Please note that this is not my professional portfolio, but rather a display of my personal side projects. For my GIScience, data design, and technical skills portfolio, please contact me at sarahbellmaps@gmail.com.You can find a more of my passion projects Behance.net/sarahbellmaps

D3js/Interactive Dataviz
US Voter Turnout 2024
Despite extensive mobilization efforts, only six states saw an increase in voter turnout rates in 2024, while all others experienced declines. This interactive visualization toggles between two perspectives—changes in voter turnout from 2020 to 2024 and each state’s variance from the national average—transforming static election data into an engaging, dynamic experience. View the interactive version here. You can also visit the static version here.
3D Mapping/Motion Graphics Animation
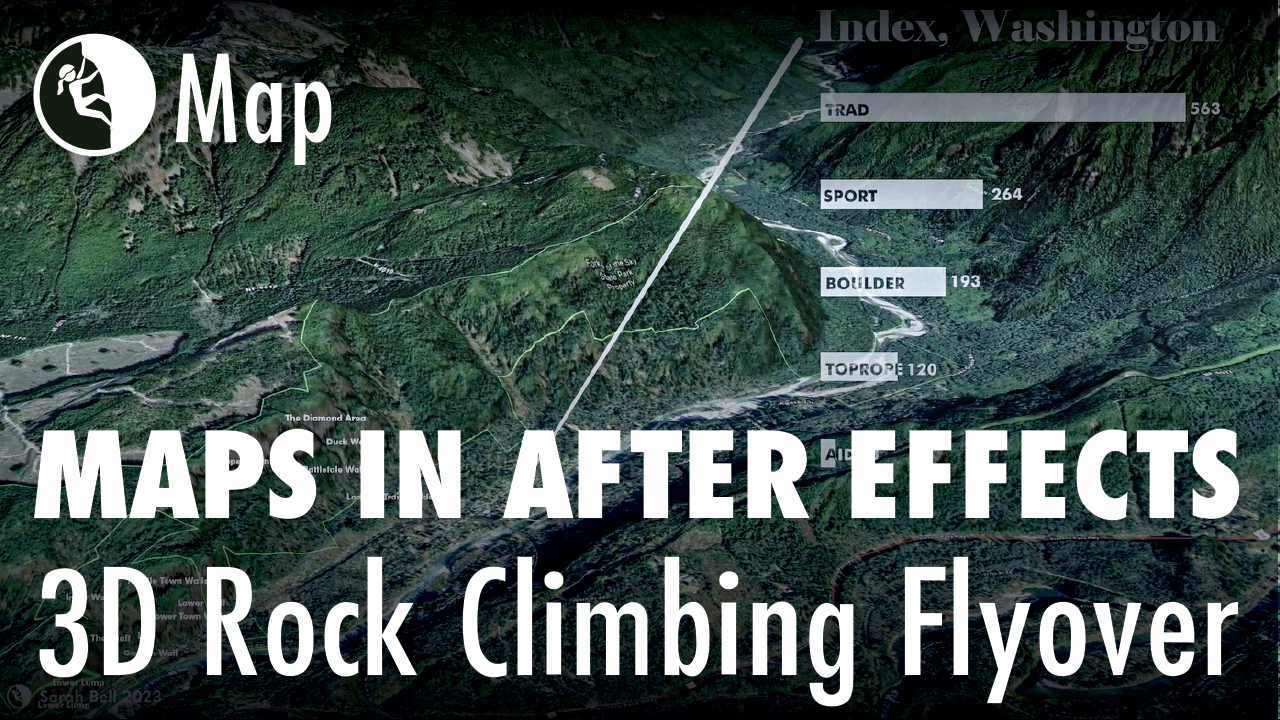
3D Map Flyover
I used ArcGIS Pro 3D mapping, Adobe Illustrator, and Adobe After Effects, and music and narration editing via Camtasia to create this animated flyover map of the fabulous Index, Washington rock climbing area. View on YouTube here.
Cartography/Motion Graphics Animation
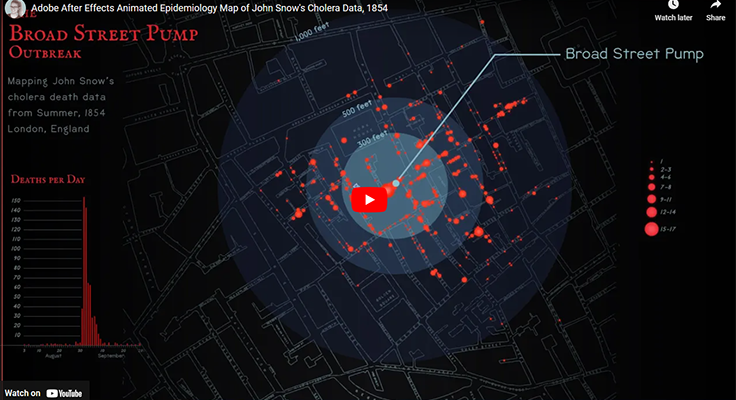
Animated Thematic Map with After Effects
I created this map for a thematic mapping talk at the Esri UC. My workflow for this map was ArcGIS Pro, Maps for Adobe, and Adobe Illustrator – then animating in Adobe After Effects. You can view the 1 min. 45 sec. map on YouTube here.
Cartography/Animation
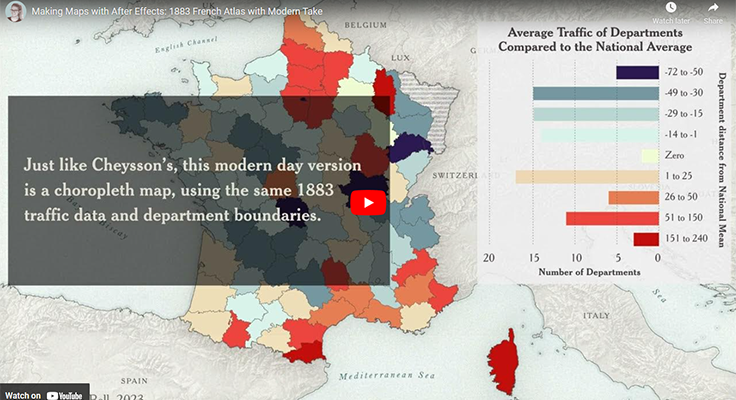
Animated Thematic Map with After Effects
My workflow for this map was ArcGIS Pro, Maps for Adobe, and Adobe Illustrator – then animating in Adobe After Effects. You can view the 1 minute map on YouTube here.

Cartography
National Parks & 30×30
I created these maps and this mock-up magazine layout for a cartography presentation to demo mapping technology. You can read more about this map creation here.
Cartography/Map-making
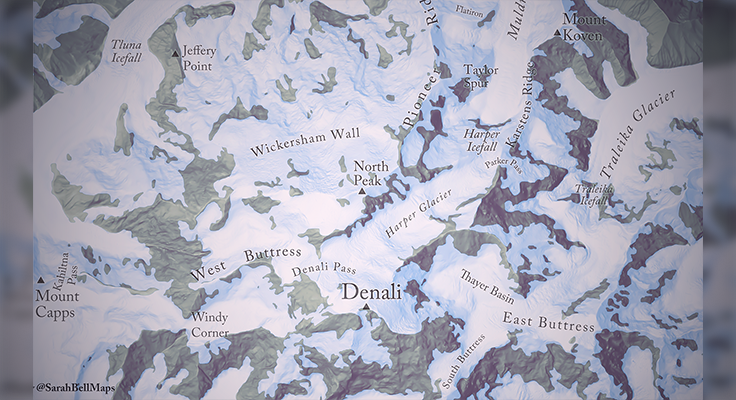
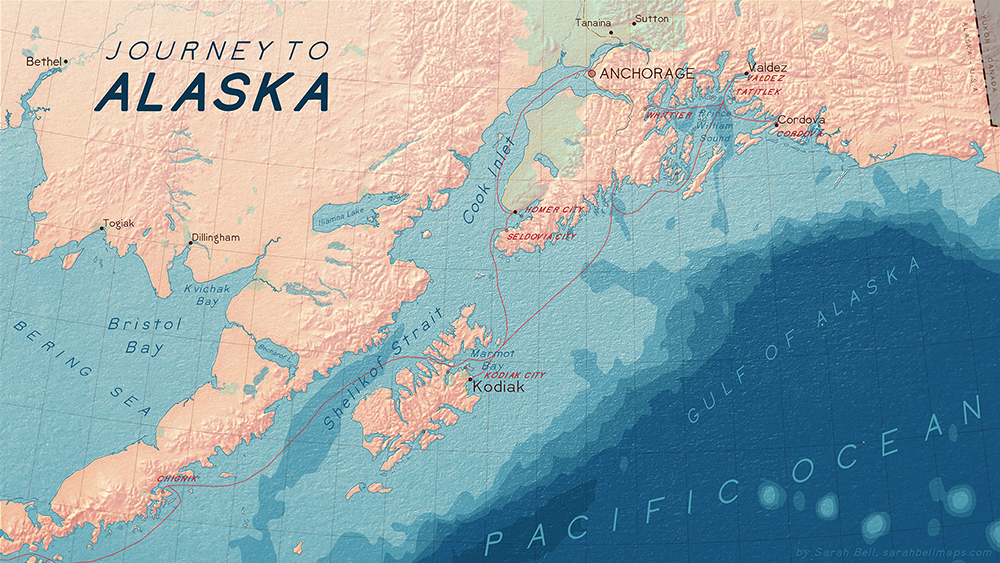
Denali Map
Previewing a small section of this map in the gorgeous glaciated state of Alaska. Read more about this map here.
Fonts/Typography
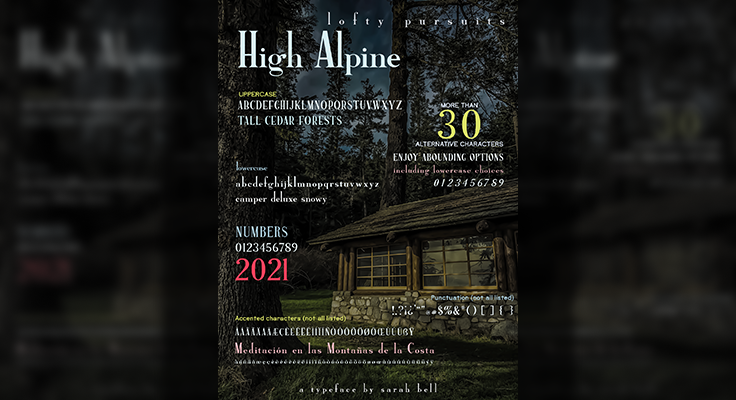
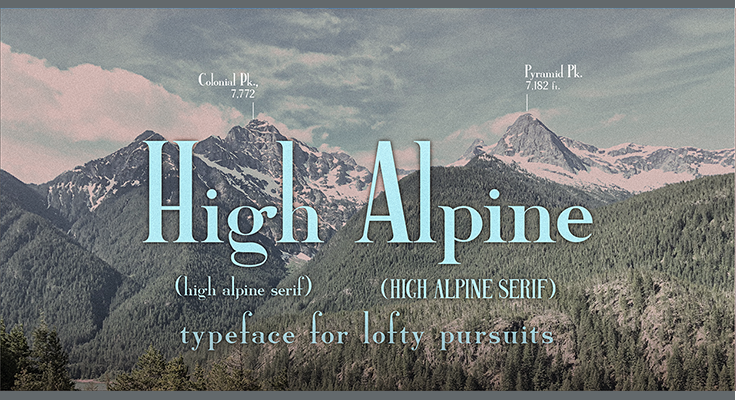
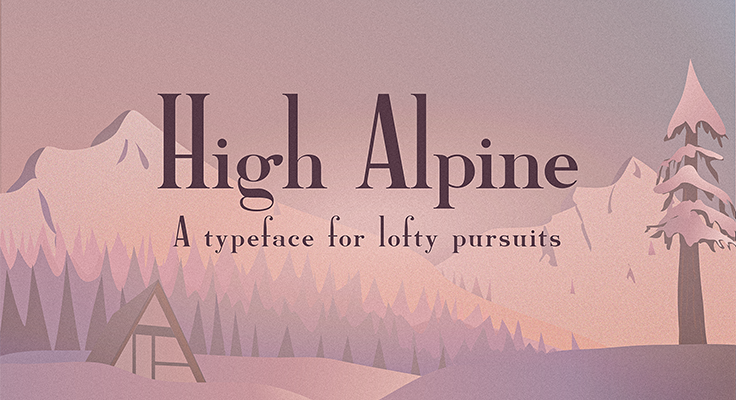
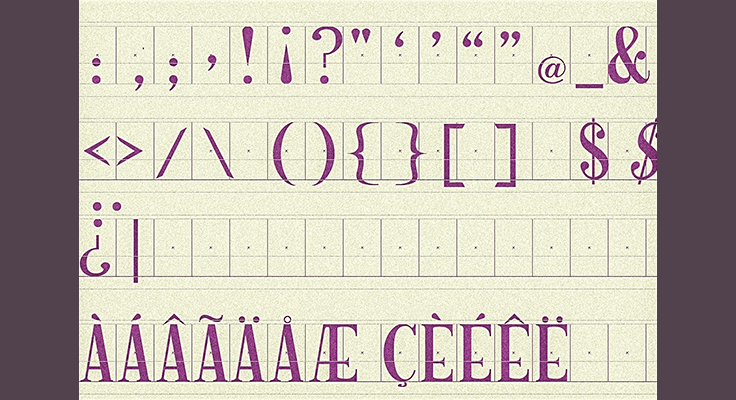
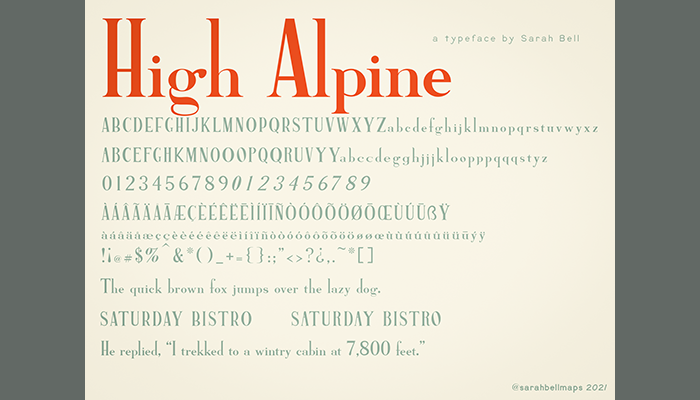
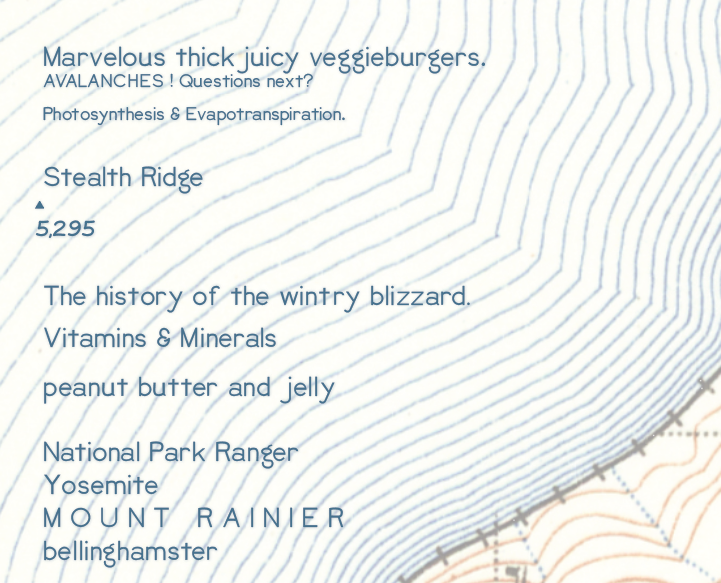
High Alpine (Serif)
I had so much fun making this serif typeface. I named it High Alpine, in part because of its perceptive height. You can download the font here.
Fonts/Typography
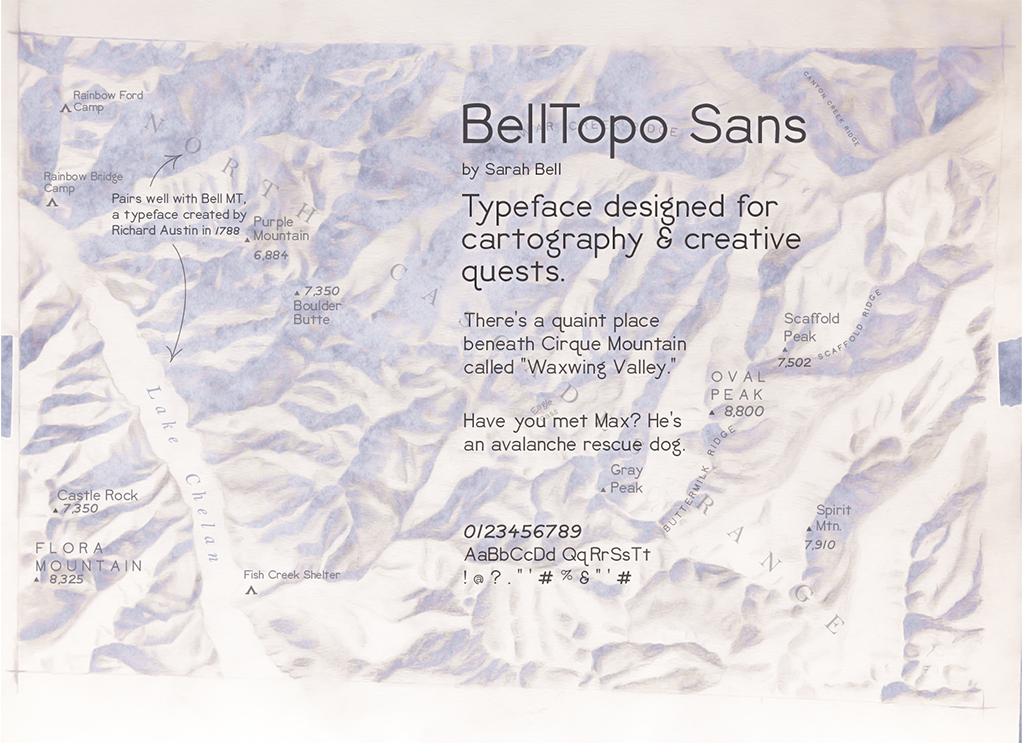
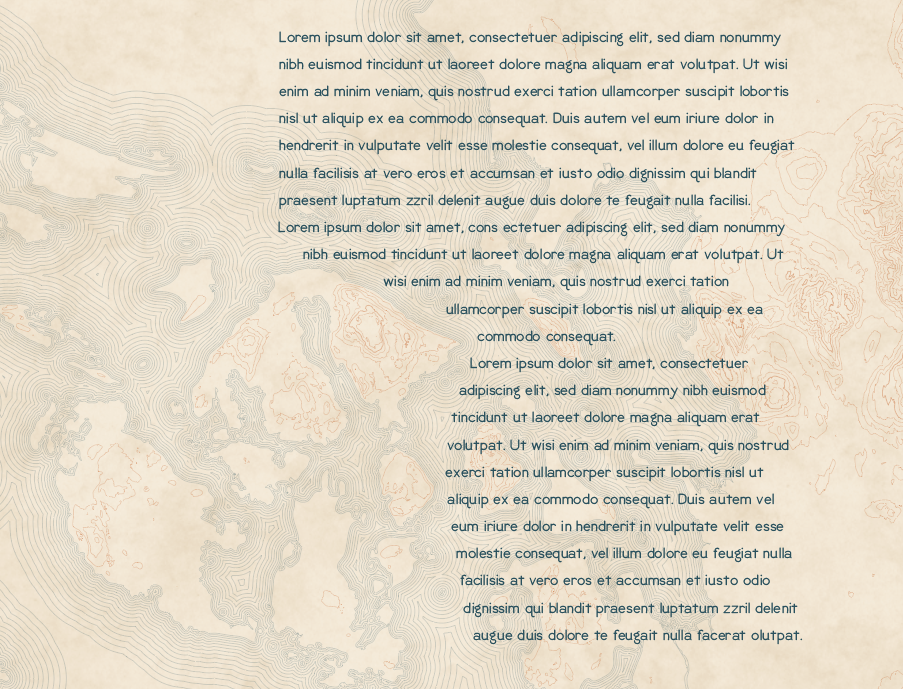
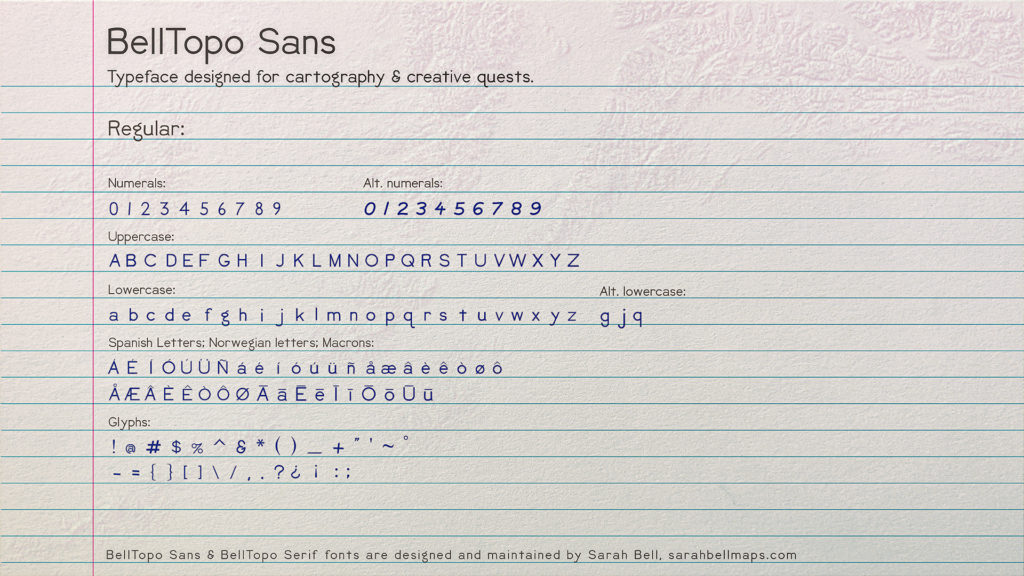
BellTopo Sans
I designed this font to be styled like antique USGS maps and similar maps of the late-1800s and early 1900s. I named it BellTopo Sans. Download this font here.
Cartography/Map-making
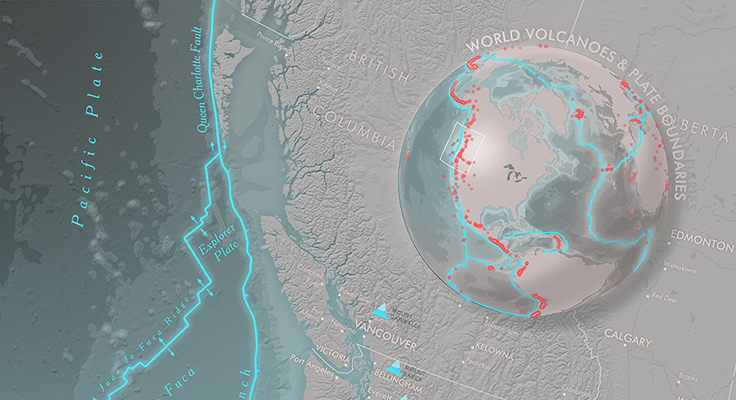
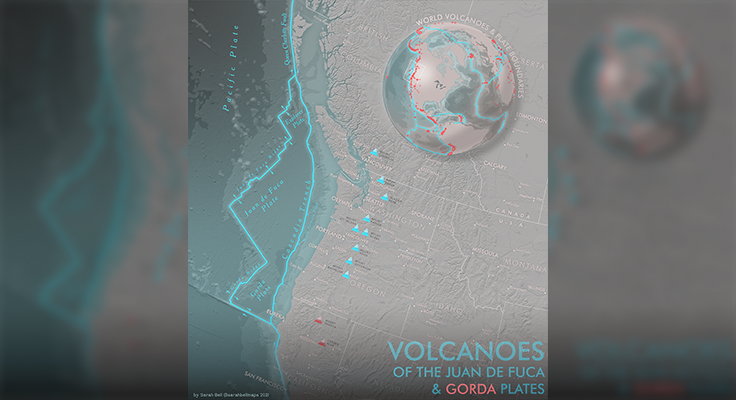
Volcanoes & Tectonic Boundaries Map
This map shows the tectonic boundaries and volcanoes of the Juan de Fuca and Gorda plate subduction. To learn how I made this map, visit here.

Cartography/Map-making
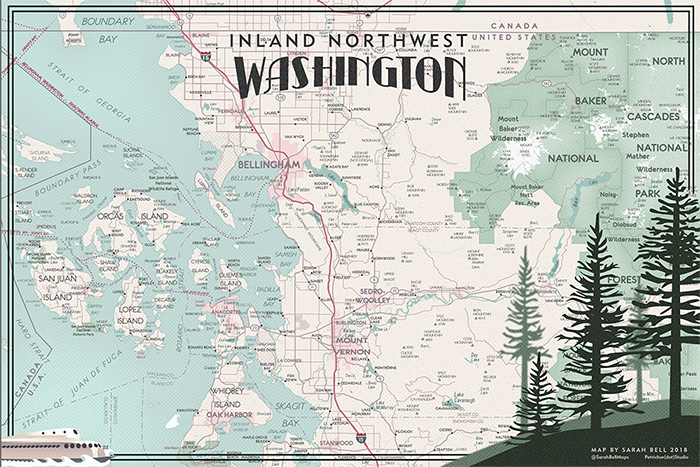
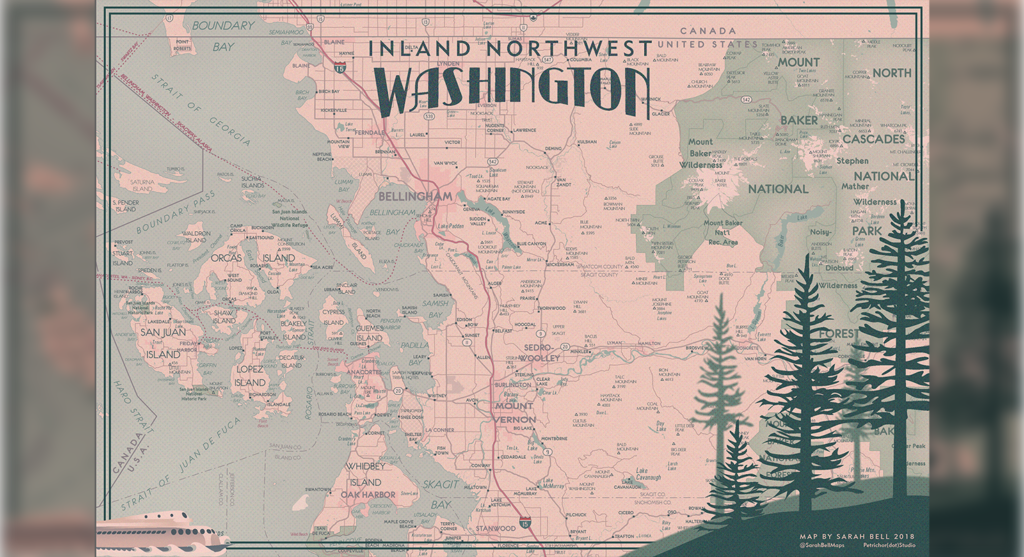
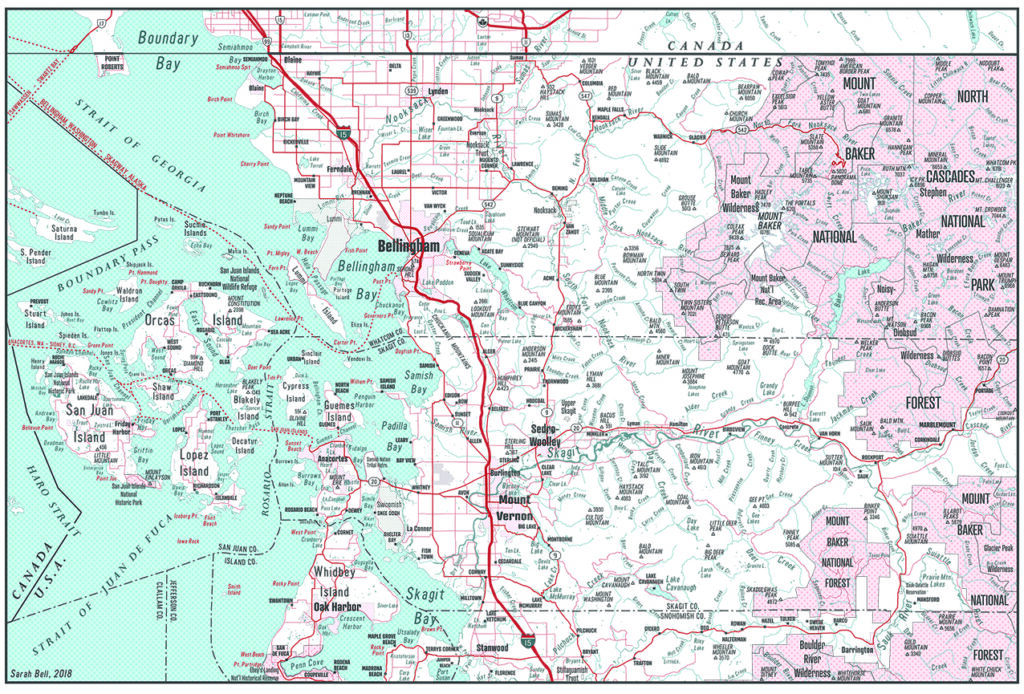
Art Deco Style Map: Northwest Washington
This map was inspired by art deco era posters. I integrated the Kalakala, an art deco era Washington state ferry. Read more about this map here.
Cartography/Map-making
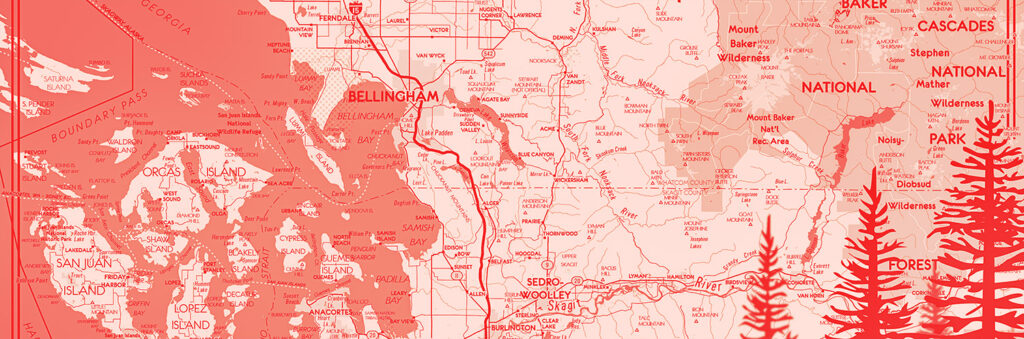
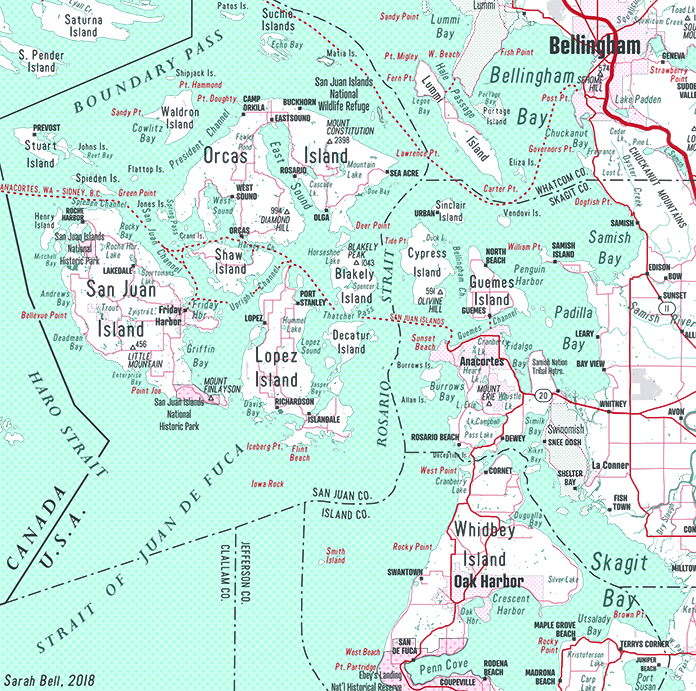
Tri-tone Mid-Century inspired Map
My inspiration for this map comes from a c.1950 map that I bought at an antique store. The bright tri-tone color palette makes it easy to read a lot of dense delicious map detail. Read more about this map here.
Cartography/Map-making
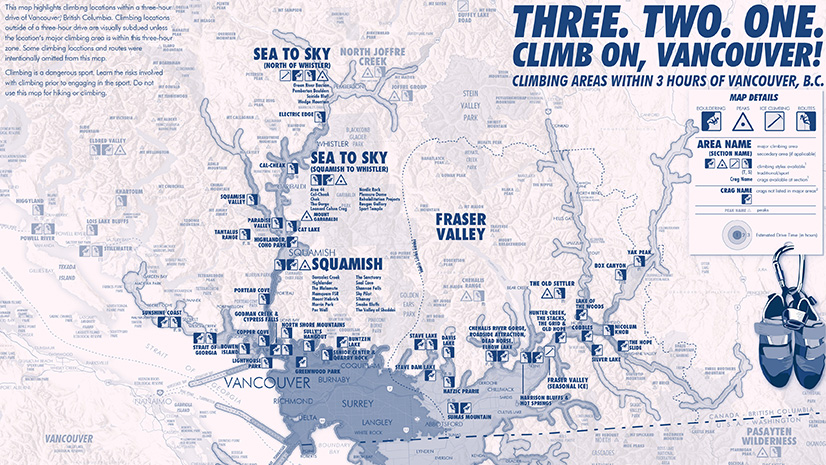
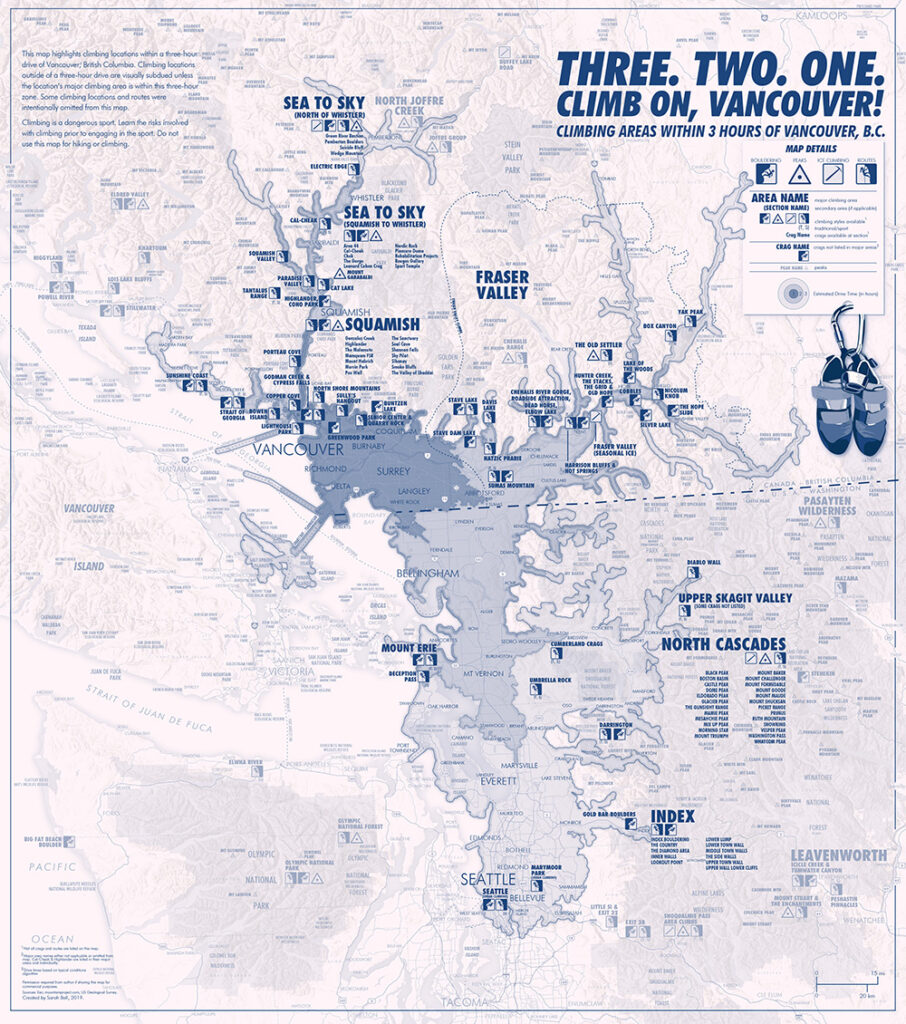
Vancouver, B.C.’s Nearest Rock Climbing
This 12 x 13.5 inch monochrome map shows rock climbing areas within a one-, two-, and three-hour drive of Canada’s beautiful west coast metropolis, Vancouver, British Columbia. To differentiate between crags and climbing areas within and outside the three-hour zone, the crags outside the zone have been visually subdued. The drive time polygons also all use the same hue, differentiating in opacity. Read about how I made this map here.

Cartography/Map-making
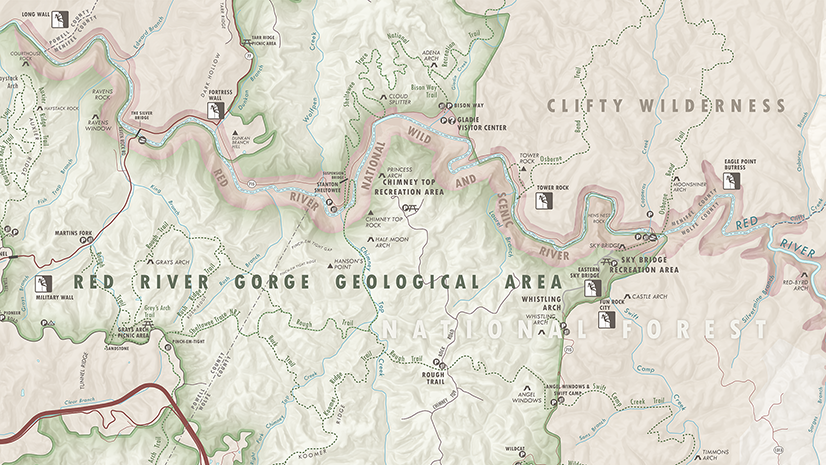
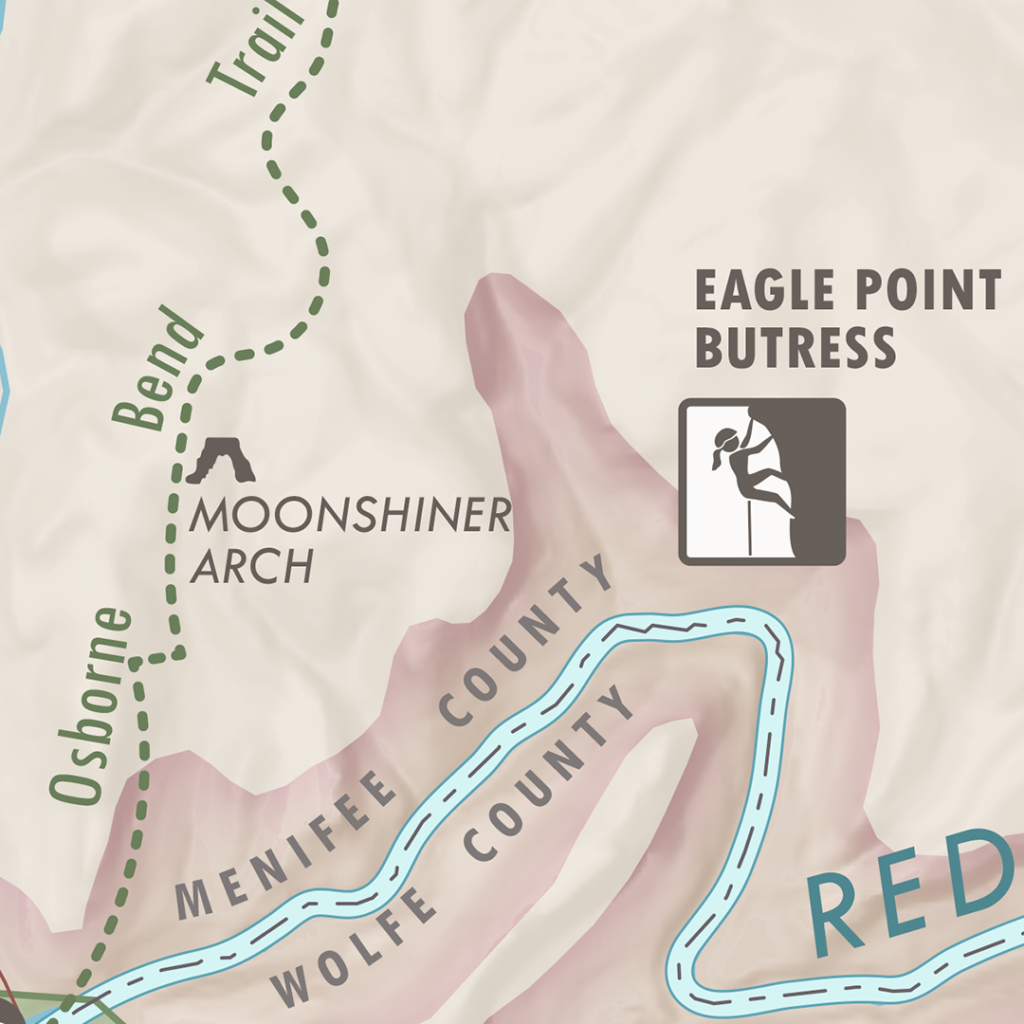
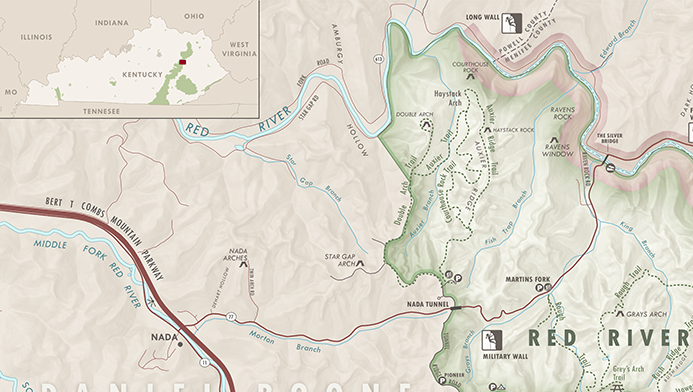
Red River Gorge Climbing Area
I created Red River Gorge Geological Area map to highlight this Kentucky gem. This map follows traditional recreation map standars that I discuss here. Each point symbol was custom-made for this map. I chose a soft-yet-clear color palatte to accenuate the point locations and roads.
Cartography/Map-making
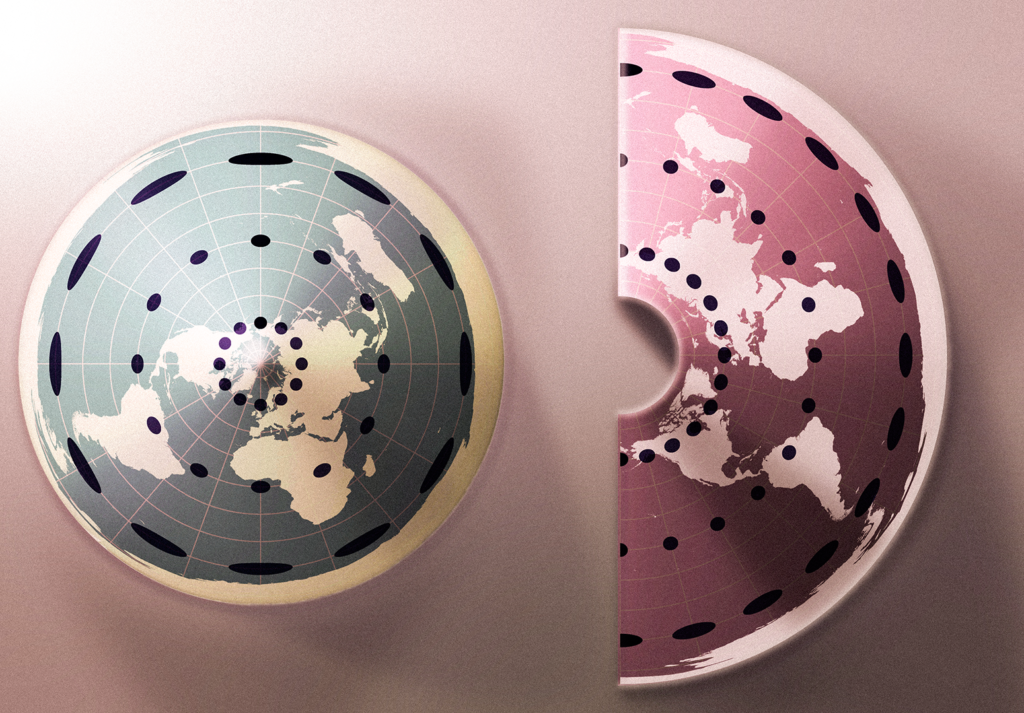
Equidistant Conic Trading Card
My contribution to the map projection trading card collection, headed by Daniel Huffman. My projection was Equidistant conic. I chose to accentuate the “cone” of the conic with some shadow rendering that is typically not included in these types of projection graphics. Read more about this map and watch the video here.
Cartography/Map-making
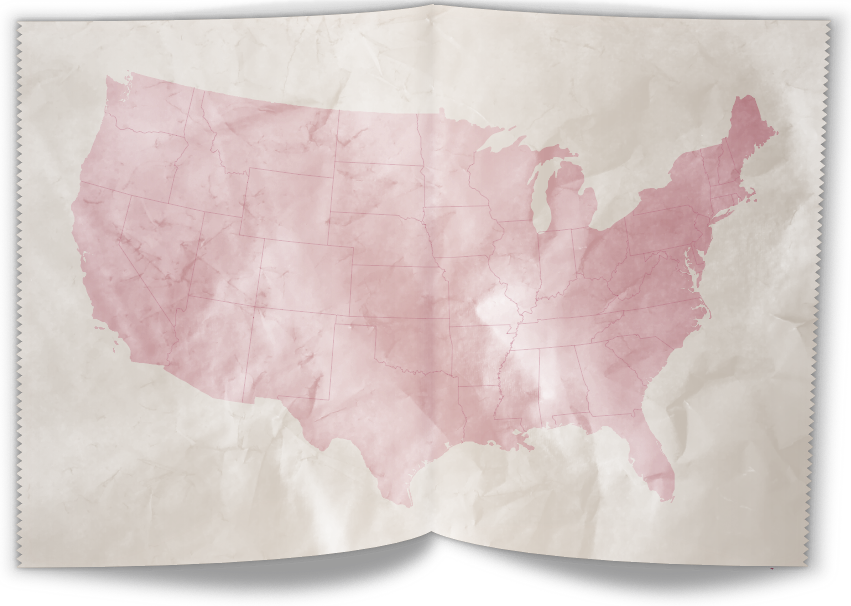
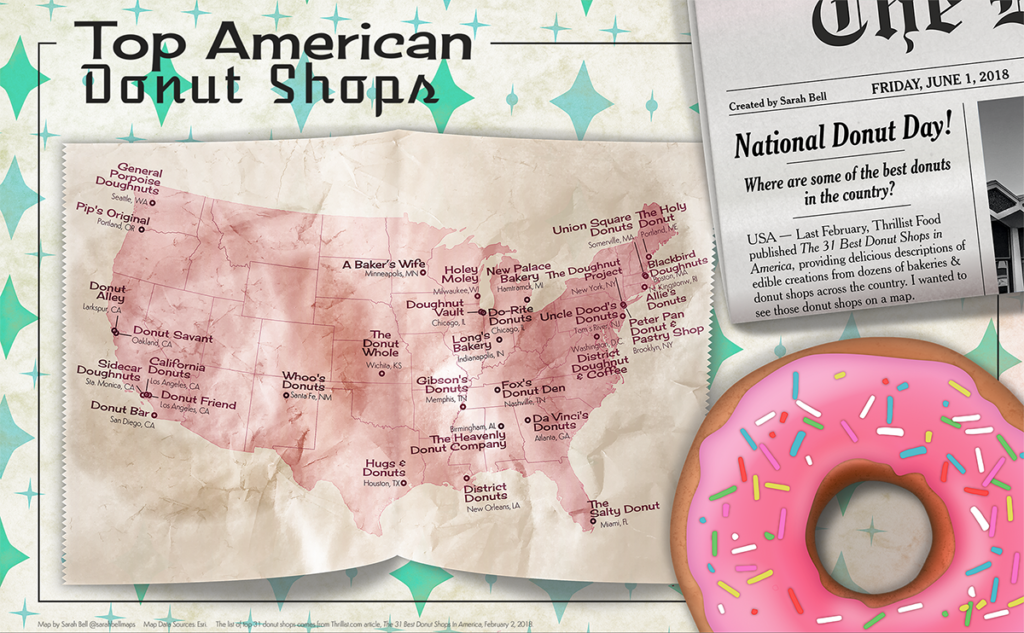
National Donut Day graphic design map
I mapped Thrillist’s “The 31 Best Donut Ships in America.” The design is inspired by 1950s diners, and includes a lot of graphic design elements. Read about how I made this map here.
Cartography/Map-making/Dataviz
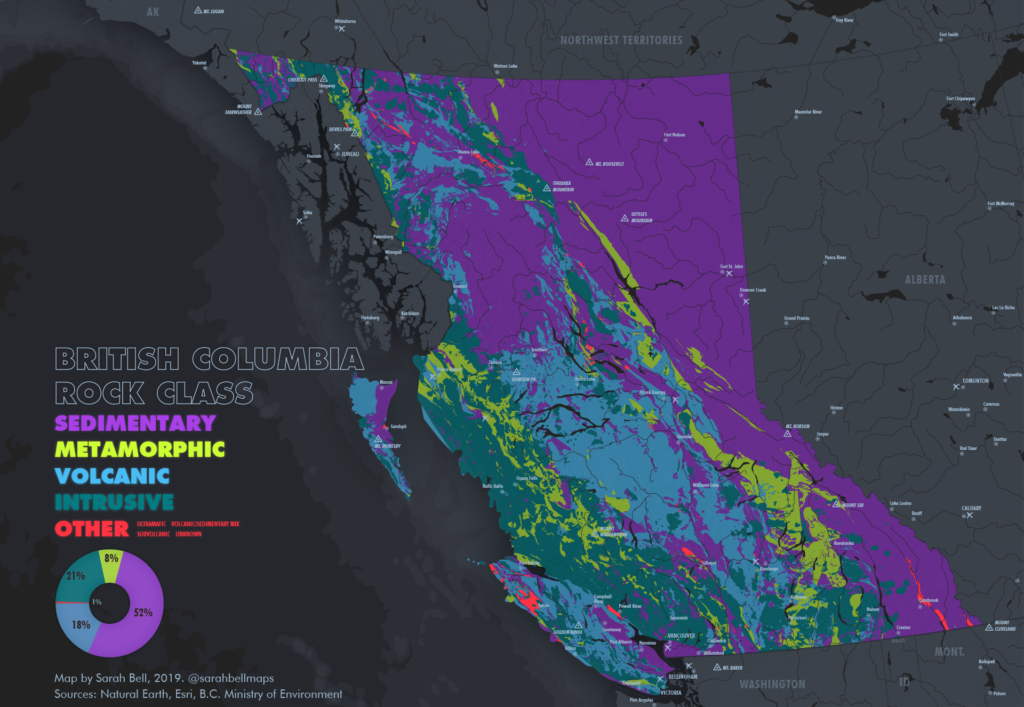
Geology Rock Class: British Columbia
The greater geologic rock classes of British Columbia, Canada. View a layer-by-layer video of this map here.
Cartography/Map-making/Fantasy Map
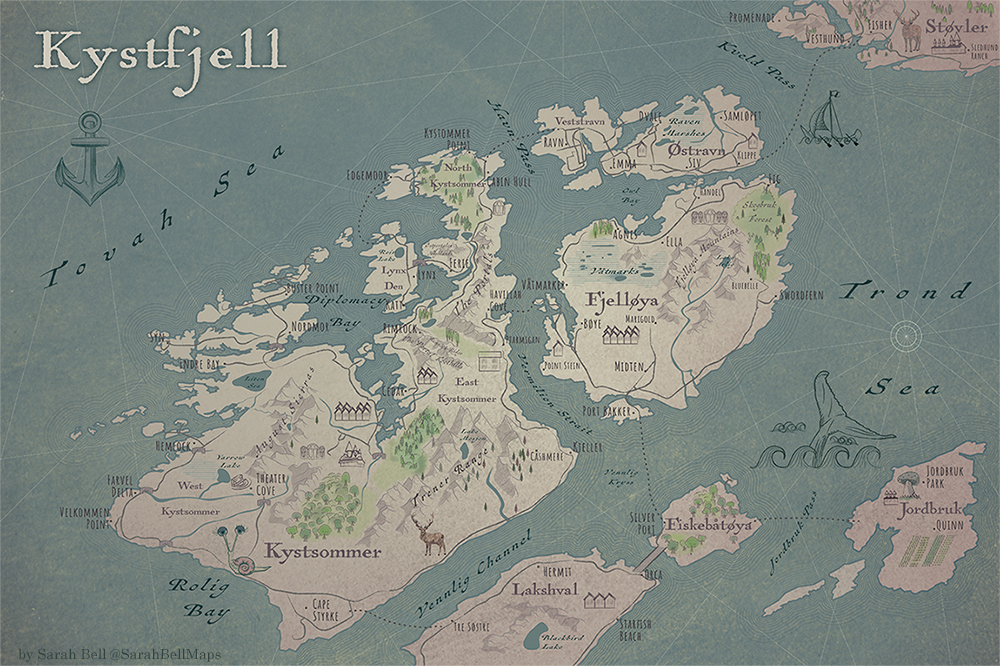
Kystfjell
A fantasy map made with real geographic data. Read a little more here.