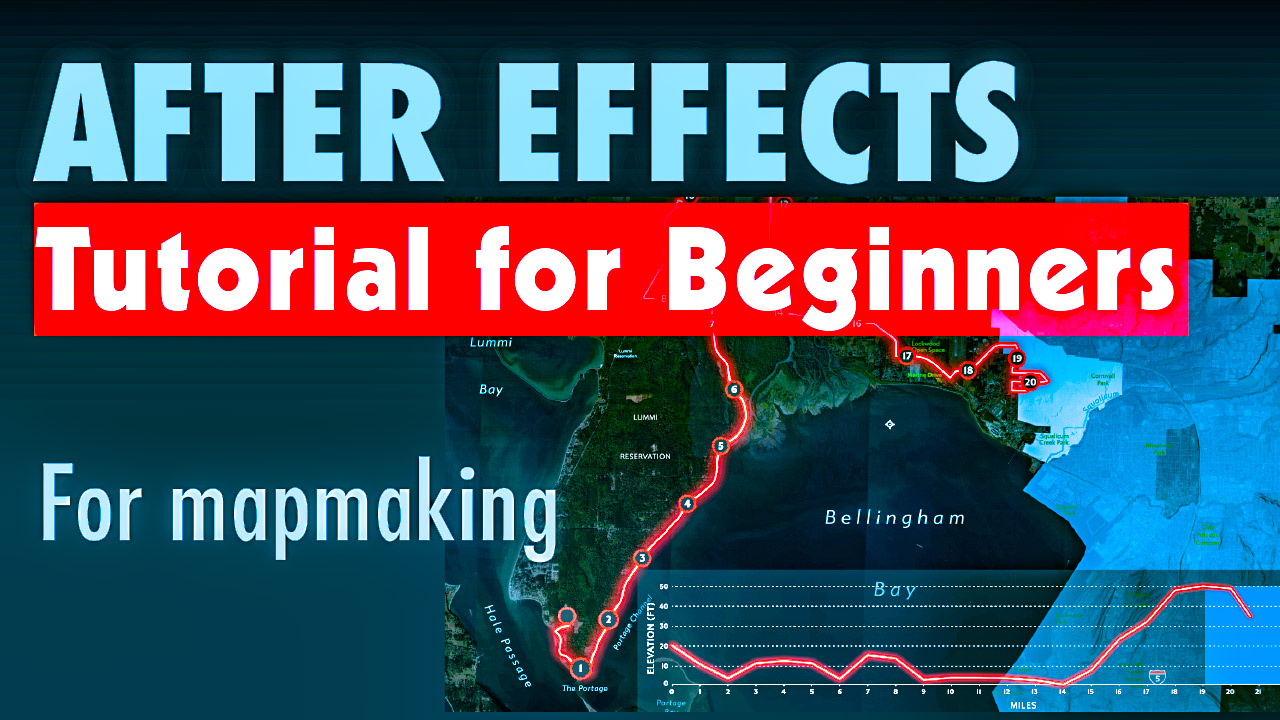
My Favorite Map Animation Workflow & Essential Resources
Discover 7 key tips for diving into After Effects as a mapmaker
Discover 7 key tips for diving into After Effects as a mapmaker

This interactive visualization toggles between two perspectives—changes in voter turnout from 2020 to 2024 and each state’s variance from the national average—transforming static election data into an engaging, dynamic experience.

America has low voter turnout, and the last general election was no exception. Only 64% of voter eligible Americans casted their ballots in 2024. This means that 90 million Americans who were eligible to vote didn’t show up to the polls. This two-page data visualization shows this drop state by state.
Last week marked Esri’s annual User Conference in San Diego, and what a conference it was! It’s always fun to see geospatial friends and meet new ones. Part of my time at this year’s gathering was spent presenting alongside Kenneth Field and John Nelson for our talk entitled “Designing Thematic Maps.” This year, Ken had…
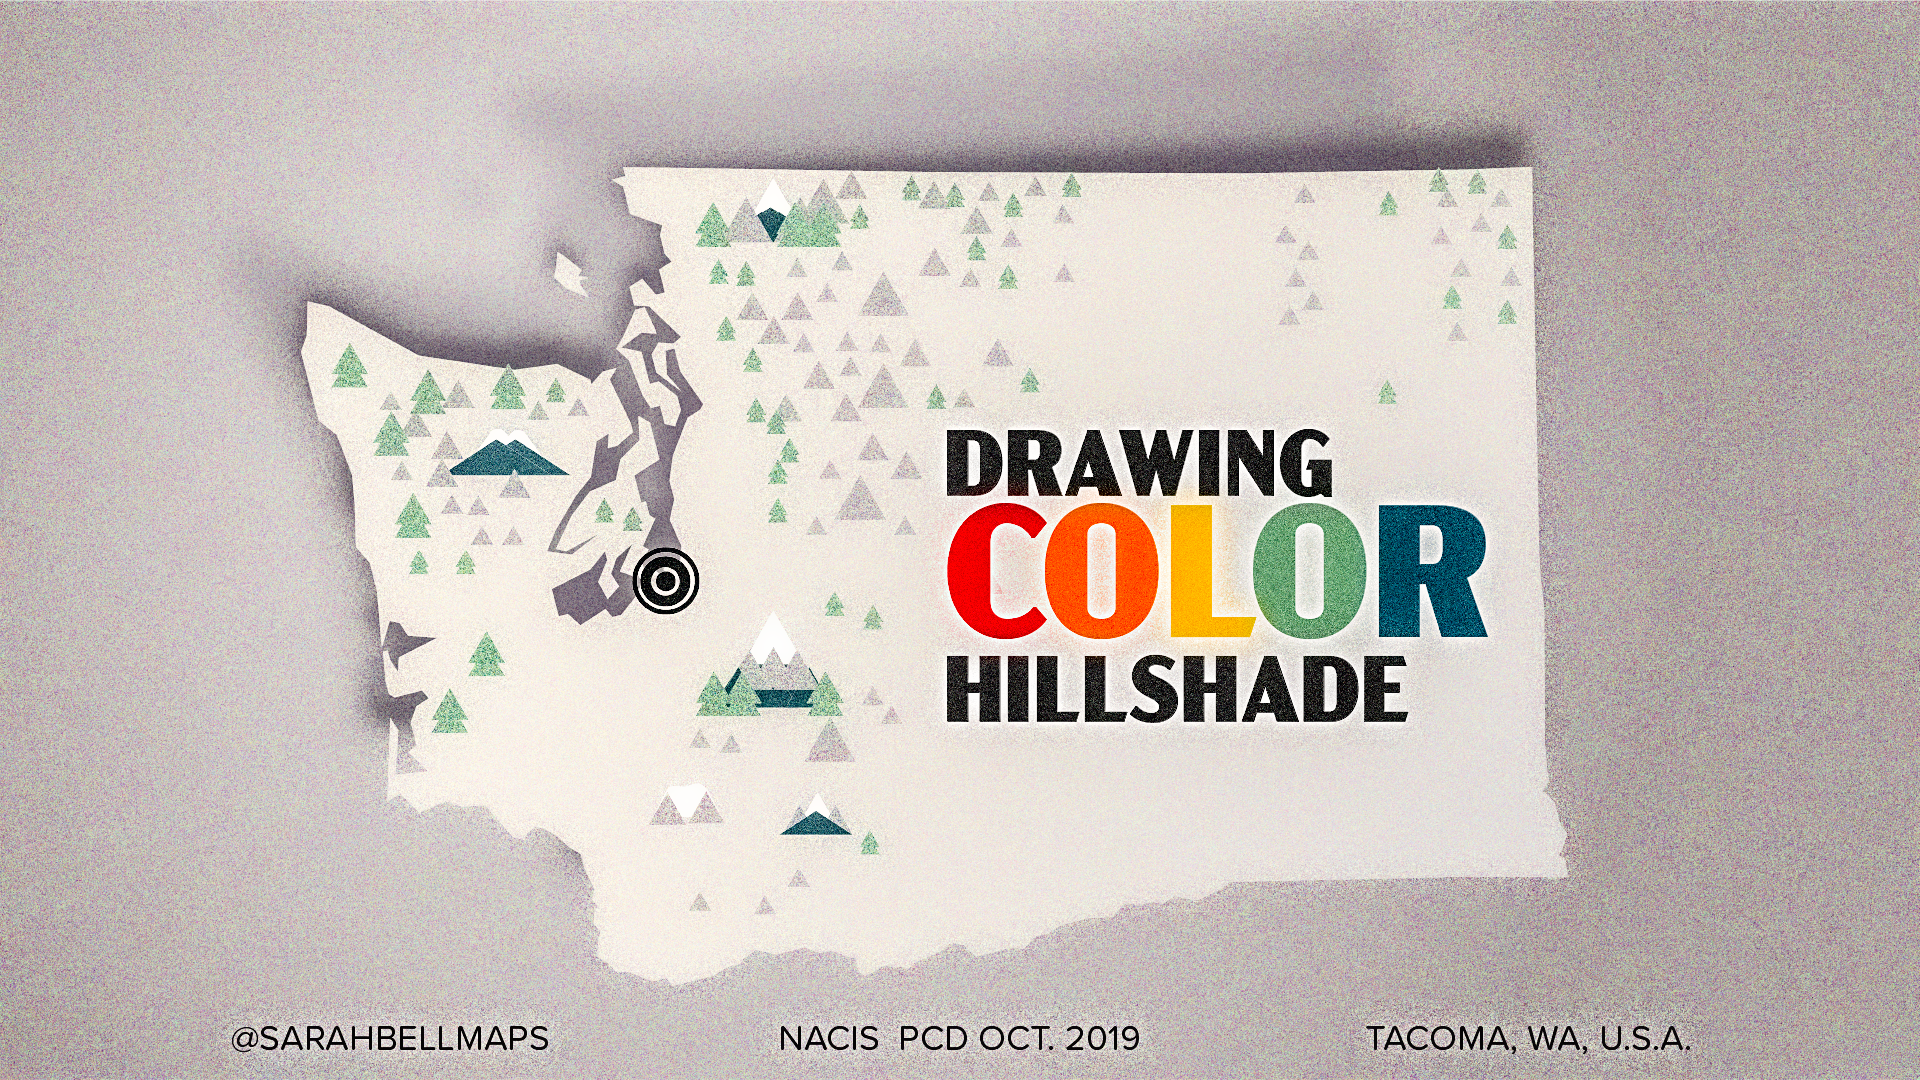
The North American Cartographic Information Society (NACIS) holds a marvelous annual conference, and this year’s was in Tacoma, Washington just 90 minutes down the road from my house. I gave a talk on the techniques I use to draw mountain topography with colored pencils. The first few minutes give a little background of my PNW…
By the time you are reading this, my colleague John Nelson and I will have presented to a bunch of fantastic creatives at Adobe MAX 2019 about making maps as designers. Designers make gorgeous maps, because oftentimes they don’t confine themselves to super strict ideas of what a map should look like. Plus, well… they’re…
Making maps is fun. As a cartographer, I’m biased to feel this way. Still, when I tell people that map-making is my career, a lot of people respond with “I love maps!” so I am not alone in realizing maps’ awesomeness. At the upcoming Adobe MAX 2019 conference I will be presenting alongside my colleague…

Last year I shared my technique for drawing hillshade with graphite (pencil). Since then, I have explored a few different methods for drawing color hillshade. I will be sharing one of those methods in this post. This method uses those graphite drawings as the base, or the starting point. So to get started, make sure…
It is January 2024! I am a cartographer working at a large geospatial software company, so time for a personal website has been rare, but I am hoping to have a more frequent presence here. Please use the contact form if you are interested in custom cartography, and visit again soon for a total update…